Growth and downside
Read net CAGR beside drawdown and volatility. Higher historical growth may come with a deeper loss or wider swings.

Inspect a seed mix, a searched alternative, or a reference portfolio without losing the context behind the numbers.
Choose a mix in each column. These fixed teaching examples show how a comparison works; no optimization runs here.
All examples use the same invented historical period and base-cost assumptions. No optimizer rank is assigned to these teaching examples.
Read net CAGR beside drawdown and volatility. Higher historical growth may come with a deeper loss or wider swings.
Inspect each ETF’s identity, weight, asset class, and role. Performance is assessed for the complete mix.
Distinguish ranking inputs, later historical tests, and modeled projections. Check costs, dates, and qualification status.
Aligned cards make it easier to follow both portfolios through the same evidence. Expand the full comparison to see growth, downside, costs, and holdings.
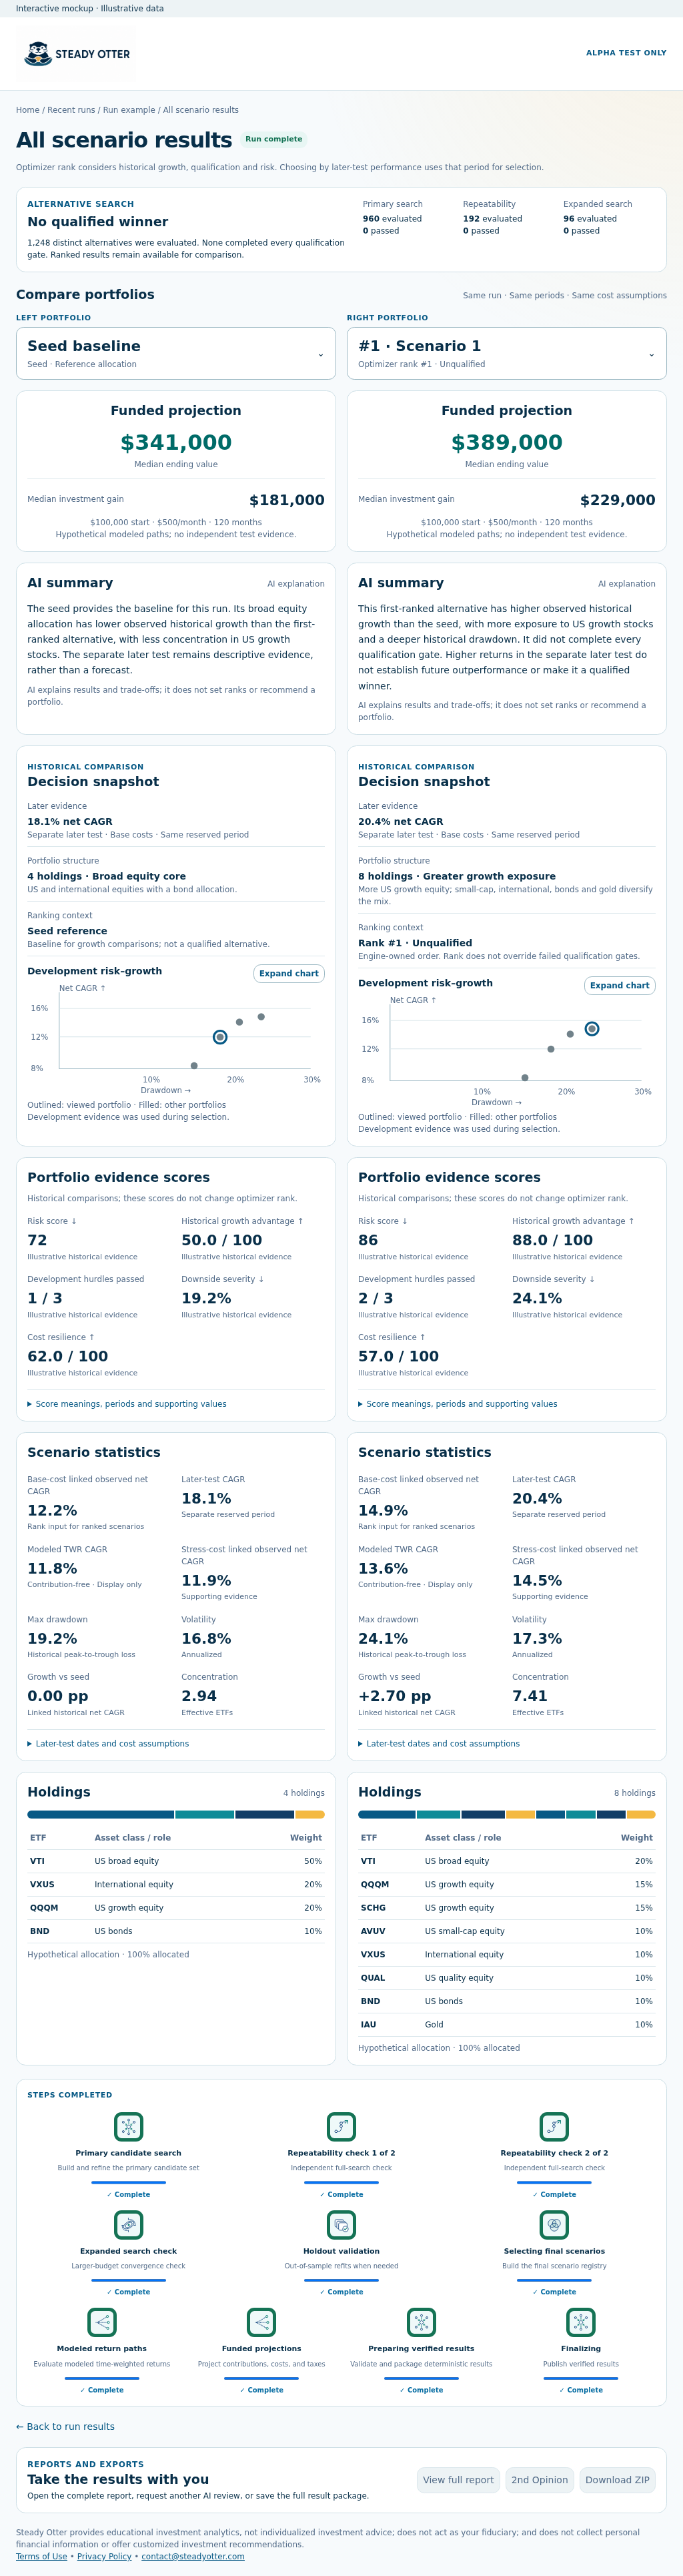
Product design screenshot · Illustrative data. This example reports “No qualified winner”: a displayed alternative can still fail qualification checks.
AI summaries explain computed results, assumptions, and trade-offs. They do not change metrics, scores, qualification, or rankings, and they do not recommend a portfolio.
Reports and a second-opinion export let you inspect the recorded evidence beyond the screen.
“What did this mix gain, what risks did it take, and did the comparison use the same assumptions?”
Historical or modeled hypothetical results are not a forecast, a suitability assessment, or a direction to invest.